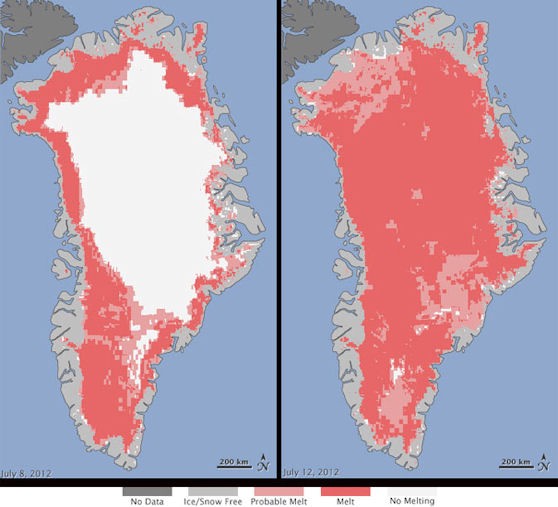
NASA reported today some truly shocking findings on the melting of the Greenland ice sheet this summer:
We reported last month on the “Unprecedented May Heat In Greenland,” where the temperature hit 76.6°F. So it would seem that unprecedented heat leads to unprecedented melting.
I saw the ABC News story tonight, which had the headline quote. I’ll post the video when it is online.
The NASA release has more detail:
Son Nghiem of NASA’s Jet Propulsion Laboratory in Pasadena, Calif., was analyzing radar data from the Indian Space Research Organisation’s (ISRO) Oceansat-2 satellite last week when he noticed that most of Greenland appeared to have undergone surface melting on July 12. Nghiem said, “This was so extraordinary that at first I questioned the result: was this real or was it due to a data error?”
Nghiem consulted with Dorothy Hall at NASA’s Goddard Space Flight Center in Greenbelt, Md. Hall studies the surface temperature of Greenland using the Moderate-resolution Imaging Spectroradiometer (MODIS) on NASA’s Terra and Aqua satellites. She confirmed that MODIS showed unusually high temperatures and that melt was extensive over the ice sheet surface.
Thomas Mote, a climatologist at the University of Georgia, Athens, Ga; and Marco Tedesco of City University of New York also confirmed the melt seen by Oceansat-2 and MODIS with passive-microwave satellite data from the Special Sensor Microwave Imager/Sounder on a U.S. Air Force meteorological satellite.
The melting spread quickly. Melt maps derived from the three satellites showed that on July 8, about 40 percent of the ice sheet’s surface had melted. By July 12, 97 percent had melted.
This extreme melt event coincided with an unusually strong ridge of warm air, or a heat dome, over Greenland. The ridge was one of a series that has dominated Greenland’s weather since the end of May. “Each successive ridge has been stronger than the previous one,” said Mote. This latest heat dome started to move over Greenland on July 8, and then parked itself over the ice sheet about three days later. By July 16, it had begun to dissipate.
Even the area around Summit Station in central Greenland, which at 2 miles above sea level is near the highest point of the ice sheet, showed signs of melting. Such pronounced melting at Summit and across the ice sheet has not occurred since 1889, according to ice cores. . . .
“Ice cores from Summit show that melting events of this type occur about once every 150 years on average. With the last one happening in 1889, this event is right on time,” says Lora Koenig, a Goddard glaciologist and a member of the research team analyzing the satellite data. “But if we continue to observe melting events like this in upcoming years, it will be worrisome.”
That statement is a classic example of what James Hansen called “scientific reticence.”
The scientific literature and recent observations — along with our ongoing lack of climate action — have long passed the worrisome stage (see the post last month “Greenland Ice Sheet Melt Nearing Critical ‘Tipping Point’ “ and links below).
Neven’s Arctic Sea Ice blog notes that “In the meantime Dr. Jason Box reports on the Meltfactor blog”:
Greenland ice sheet record surface melting underway
While the potential impact of wildfires on darkening the Greenland ice sheet surface remain to be resolved, there is mounting evidence of an extreme year 2012 melt.
Melt signatures from active microwave remote sensing are stronger than in recent years over the upper areas of the ice sheet. Dark areas indicate absorption of the microwave signal emitted by the satellite. While, year 2010 and 2011 are recognized as being record melt years (Tedesco et al. 2011, van As et al. 2011), year 2012 melting appears to be more extensive.
… In my recently accepted albedo paper (Box et al. 2012, ACCEPTED VERSION), see abstract, the statement: “it is reasonable to expect 100% melt area over the ice sheet within another similar decade of warming.” [May be coming true already.]
Neven also directs us to ScienceDaily, which reports:
Surprising Link Between Ice and Atmosphere: GPS Can Now Measure Ice Melt, Change in Greenland Over Months Rather Than Years
ScienceDaily (July 24, 2012) — Researchers have found a way to use GPS to measure short-term changes in the rate of ice loss on Greenland — and reveal a surprising link between the ice and the atmosphere above it
The study, published in the early online edition of the Proceedings of the National Academy of Sciences, hints at the potential for GPS to detect many consequences of climate change, including ice loss, the uplift of bedrock, changes in air pressure — and perhaps even sea level rise.
The team, led by earth scientists at Ohio State University, pinpointed a period in 2010 when high temperatures caused the natural ice flow out to sea to suddenly accelerate, and 100 billion tons of ice melted away from the continent in only 6 months. . . .
Is it worrisome yet?
Related Posts:
- Greenland Ice Sheet “Could Undergo a Self-Amplifying Cycle of Melting and Warming … Difficult to Halt,” Scientists Find
- JPL bombshell: Polar ice sheet mass loss is speeding up, on pace for 1 foot sea level rise by 2050
- New study of Greenland under “more realistic forcings” concludes “collapse of the ice-sheet was found to occur between 400 and 560 ppm” of CO2
- M.I.T. doubles its 2095 business-as-usual warming projection to 10°F — with 866 ppm and Arctic warming of 20°F
- Science: CO2 levels haven’t been this high for 15 million years, when it was 5° to 10°F warmer and seas were 75 to 120 feet higher: “We have shown that this dramatic rise in sea level is associated with an increase in CO2 levels of about 100 ppm.”
- Sea levels may rise 3 times faster than IPCC estimated, could hit 6 feet by 2100