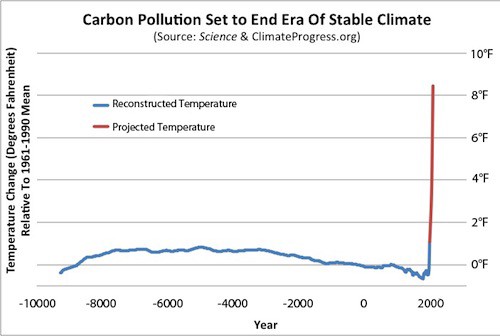
Earlier this month, we reported on a new study by Marcott et al. in Science: Recent Warming Is ‘Amazing And Atypical’ And Poised To Destroy Stable Climate That Enabled Civilization. It was the source of most of the data in this popular, jaw-dropping graph:
Temperature change over past 11,300 years (in blue, via Science, 2013) plus projected warming this century on humanity’s current emissions path (in red, via recent literature).
Now Real Climate has posted a summary and FAQ by Shaun Marcott and colleagues, which I’ll excerpt below. As the real climate scientists at RC note:
Our view is that the results of the paper will stand the test of time, particularly regarding the small global temperature variations in the Holocene. If anything, early Holocene warmth might be overestimated in this study.
The main, stunning conclusion we can draw from the paper is that the rate of warming since 1900 is 50 times greater than the rate of cooling in the previous 5000 years, which undermines the whole notion of adaptation.
But the study also means the famous “Hockey Stick” graph is correct (and indeed too optimistic — even by mid-century, the hockey stick actually looks more like a brick wall for humanity, as the figure shows).
Of course, the deniers can’t stomach any independent support for the hockey stick, even though countless studies have now backed it up. So the lemming-like disinformer blogs continue to press the most inane attack on Marcott et al., arguing that the warming of the past century the authors found in their proxy records is in error.
What makes this so anti-scientific is that the uptick just happens to match the uptick in the heavily documented and independently verified instrumental record. So the disinformers are spending most of their time attacking the one part of the paper that we know unequivocally matches reality — see, for instance, Koch-Funded Study Finds ‘Global Warming Is Real’, ‘On The High End’ And ‘Essentially All’ Due To Carbon Pollution. See also Tamino, who has some good posts on the paper. And see NOAA (2013): ‘Robust, Unambiguous’ Independent Evidence Confirms The Recent Global Warming Measured By Thermometers.
And speaking of inane, there is a manufactured dust-up on twitter that somehow posting a blog piece on Easter Sunday is like making an unpopular political announcement on a Friday. But in fact, unlike Friday afternoon, Sunday is a great day to post a piece if you want high readership and traffic, as anyone who blogs regularly should know. If someone didn’t want a blog article to be read, they simply wouldn’t post it!
Here is an excerpt of the RealClimate post by Sean Marcott and his coauthors about their paper:
Summary and FAQ’s related to the study by Marcott et al. (2013, Science)
Prepared by Shaun A. Marcott, Jeremy D. Shakun, Peter U. Clark, and Alan C. Mix
Primary results of studyGlobal Temperature Reconstruction: We combined published proxy temperature records from across the globe to develop regional and global temperature reconstructions spanning the past ~11,300 years with a resolution >300 yr; previous reconstructions of global and hemispheric temperatures primarily spanned the last one to two thousand years. To our knowledge, our work is the first attempt to quantify global temperature for the entire Holocene.
Structure of the Global and Regional Temperature Curves: We find that global temperature was relatively warm from approximately 10,000 to 5,000 years before present. Following this interval, global temperature decreased by approximately 0.7°C, culminating in the coolest temperatures of the Holocene around 200 years before present during what is commonly referred to as the Little Ice Age. The largest cooling occurred in the Northern Hemisphere.
Holocene Temperature Distribution: Based on comparison of the instrumental record of global temperature change with the distribution of Holocene global average temperatures from our paleo-reconstruction, we find that the decade 2000–2009 has probably not exceeded the warmest temperatures of the early Holocene, but is warmer than ~75% of all temperatures during the Holocene. In contrast, the decade 1900–1909 was cooler than~95% of the Holocene. Therefore, we conclude that global temperature has risen from near the coldest to the warmest levels of the Holocene in the past century. Further, we compare the Holocene paleotemperature distribution with published temperature projections for 2100 CE, and find that these projections exceed the range of Holocene global average temperatures under all plausible emissions scenarios.
Frequently Asked Questions and AnswersQ: What is global temperature?
A: Global average surface temperature is perhaps the single most representative measure of a planet’s climate since it reflects how much heat is at the planet’s surface. Local temperature changes can differ markedly from the global average. One reason for this is that heat moves around with the winds and ocean currents, warming one region while cooling another, but these regional effects might not cause a significant change in the global average temperature. A second reason is that local feedbacks, such as changes in snow or vegetation cover that affect how a region reflects or absorbs sunlight, can cause large local temperature changes that are not mirrored in the global average. We therefore cannot rely on any single location as being representative of global temperature change. This is why our study includes data from around the world.
We can illustrate this concept with temperature anomaly data based on instrumental records for the past 130 years from the National Climatic Data Center (http://www.ncdc.noaa.gov/cmb-faq/anomalies.php#anomalies). Over this time interval, an increase in the global average temperature is documented by thermometer records, rising sea levels, retreating glaciers, and increasing ocean heat content, among other indicators. Yet if we plot temperature anomaly data since 1880 at the same locations as the 73 sites used in our paleotemperature study, we see that the data are scattered and the trend is unclear. When these same 73 historical temperature records are averaged together, we see a clear warming signal that is very similar to the global average documented from many more sites (Figure 1). Averaging reduces local noise and provides a clearer perspective on global climate.

Figure 1: Temperature anomaly data (thin colored lines) at the same locations as the 73 paleotemperature records used in Marcott et al. (2013), the average of these 73 temperature anomaly series (bold black line), and the global average temperature from the National Climatic Data Center blended land and ocean dataset (bold red line) (data from Smith et al., 2008).
New Scientist magazine has an “app” that allows one to point-and-plot instrumental temperatures for any spot on the map to see how local temperature changes compare to the global average over the past century (http://warmingworld.newscientistapps.com/).
Q: How does one go about reconstructing temperatures in the past?
A: Changes in Earth’s temperature for the last ~160 years are determined from instrumental data, such as thermometers on the ground or, for more recent times, satellites looking down from space. Beyond about 160 years ago, we must turn to other methods that indirectly record temperature (called “proxies”) for reconstructing past temperatures. For example, tree rings, calibrated to temperature over the instrumental era, provide one way of determining temperatures in the past, but few trees extend beyond the past few centuries or millennia. To develop a longer record, we used primarily marine and terrestrial fossils, biomolecules, or isotopes that were recovered from ocean and lake sediments and ice cores. All of these proxies have been independently calibrated to provide reliable estimates of temperature.
Q: Did you collect and measure the ocean and land temperature data from all 73 sites?
A: No. All of the datasets were previously generated and published in peer-reviewed scientific literature by other researchers over the past 15 years. Most of these datasets are freely available at several World Data Centers (see links below); those not archived as such were graciously made available to us by the original authors. We assembled all these published data into an easily used format, and in some cases updated the calibration of older data using modern state-of-the-art calibrations. We made all the data available for download free-of-charge from the Science web site (see link below). Our primary contribution was to compile these local temperature records into “stacks” that reflect larger-scale changes in regional and global temperatures. We used methods that carefully consider potential sources of uncertainty in the data, including uncertainty in proxy calibration and in dating of the samples (see step-by-step methods below).
NOAA National Climate Data Center:http://www.ncdc.noaa.gov/paleo/paleo.htmlPANGAEA:http://www.pangaea.de/Holocene Datasets:http://www.sciencemag.org/content/339/6124/1198/suppl/DC1Q: Why use marine and terrestrial archives to reconstruct global temperature when we have the ice cores from Greenland and Antarctica?
A: While we do use these ice cores in our study, they are limited to the polar regions and so give only a local or regional picture of temperature changes. Just as it would not be reasonable to use the recent instrumental temperature history from Greenland (for example) as being representative of the planet as a whole, one would similarly not use just a few ice cores from polar locations to reconstruct past temperature change for the entire planet.
Q: Why only look at temperatures over the last 11,300 years?
A: Our work was the second half of a two-part study assessing global temperature variations since the peak of the last Ice Age about 22,000 years ago. The first part reconstructed global temperature over the last deglaciation (22,000 to 11,300 years ago) (Shakun et al., 2012, Nature 484, 49–55; see also http://www.people.fas.harvard.edu/~shakun/FAQs.html), while our study focused on the current interglacial warm period (last 11,300 years), which is roughly the time span of developed human civilizations.
Q: Is your paleotemperature reconstruction consistent with reconstructions based on the tree-ring data and other archives of the past 2,000 years?
A: Yes, in the parts where our reconstruction contains sufficient data to be robust, and acknowledging its inherent smoothing. For example, our global temperature reconstruction from ~1500 to 100 years ago is indistinguishable (within its statistical uncertainty) from the Mann et al. (2008) reconstruction, which included many tree-ring based data. Both reconstructions document a cooling trend from a relatively warm interval (~1500 to 1000 years ago) to a cold interval (~500 to 100 years ago, approximately equivalent to the Little Ice Age).
Q: What do paleotemperature reconstructions show about the temperature of the last 100 years?
A: Our global paleotemperature reconstruction includes a so-called “uptick” in temperatures during the 20th-century. However, in the paper we make the point that this particular feature is of shorter duration than the inherent smoothing in our statistical averaging procedure, and that it is based on only a few available paleo-reconstructions of the type we used. Thus, the 20th century portion of our paleotemperature stack is not statistically robust, cannot be considered representative of global temperature changes, and therefore is not the basis of any of our conclusions. Our primary conclusions are based on a comparison of the longer term paleotemperature changes from our reconstruction with the well-documented temperature changes that have occurred over the last century, as documented by the instrumental record. Although not part of our study, high-resolution paleoclimate data from the past ~130 years have been compiled from various geological archives, and confirm the general features of warming trend over this time interval (Anderson, D.M. et al., 2013, Geophysical Research Letters, v. 40, p. 189–193; http://www.agu.org/journals/pip/gl/2012GL054271-pip.pdf).
Q: Is the rate of global temperature rise over the last 100 years faster than at any time during the past 11,300 years?
A: Our study did not directly address this question because the paleotemperature records used in our study have a temporal resolution of ~120 years on average, which precludes us from examining variations in rates of change occurring within a century. Other factors also contribute to smoothing the proxy temperature signals contained in many of the records we used, such as organisms burrowing through deep-sea mud, and chronological uncertainties in the proxy records that tend to smooth the signals when compositing them into a globally averaged reconstruction. We showed that no temperature variability is preserved in our reconstruction at cycles shorter than 300 years, 50% is preserved at 1000-year time scales, and nearly all is preserved at 2000-year periods and longer. Our Monte-Carlo analysis accounts for these sources of uncertainty to yield a robust (albeit smoothed) global record. Any small “upticks” or “downticks” in temperature that last less than several hundred years in our compilation of paleoclimate data are probably not robust, as stated in the paper.
Q: How do you compare the Holocene temperatures to the modern instrumental data?
A: One of our primary conclusions is based on Figure 3 of the paper, which compares the magnitude of global warming seen in the instrumental temperature record of the past century to the full range of temperature variability over the entire Holocene based on our reconstruction. We conclude that the average temperature for 1900–1909 CE in the instrumental record was cooler than ~95% of the Holocene range of global temperatures, while the average temperature for 2000–2009 CE in the instrumental record was warmer than ~75% of the Holocene distribution. As described in the paper and its supplementary material, Figure 3 provides a reasonable assessment of the full range of Holocene global average temperatures, including an accounting for high-frequency changes that might have been damped out by the averaging procedure.
Q: What about temperature projections for the future?
A: Our study used projections of future temperature published in the Fourth Assessment of the Intergovernmental Panel on Climate Change in 2007, which suggest that global temperature is likely to rise 1.1–6.4°C by the end of the century (relative to the late 20th century), depending on the magnitude of anthropogenic greenhouse gas emissions and the sensitivity of the climate to those emissions. Figure 3 in the paper compares these published projected temperatures from various emission scenarios to our assessment of the full distribution of Holocene temperature distributions. For example, a middle-of-the-road emission scenario (SRES A1B) projects global mean temperatures that will be well above the Holocene average by the year 2100 CE. Indeed, if any of the six emission scenarios considered by the IPCC that are shown on Figure 3 are followed, future global average temperatures, as projected by modeling studies, will likely be well outside anything the Earth has experienced in the last 11,300 years, as shown in Figure 3 of our study.
You can read a discussion of more “technical questions and answers” by the authors here.